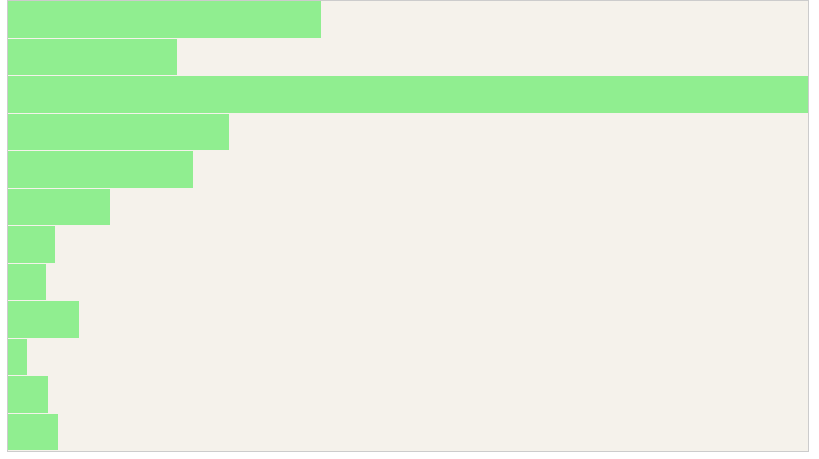
Bar Chart
Appending SVG Tags Programmatically
var svg = d3.select("body").append("svg")
.attr("id", "chart")
.attr("width", 800)
.attr("height", 450)
Methodology:
html body selector -> appending DOM type -> defining attributes
Bar Chart, Basic Layout
var data = [132,71,337,93,78,43,20,16,30,8,17,21];
var svg = d3.select("body").append("svg")
.attr("id", "chart")
.attr("width", 800)
.attr("height", 450)
svg.selectAll(".bar") // attribute class
.data(data) // data source
.enter() // bind data
.append("rect") // append a rectangle for each element in data
.attr("class", "bar") // future attributes
.attr("x", 0) // x position
.attr("y", function(d, i) {
return 20 * i;
}) // y position stacked reletive to i
.attr("width", function(d, i) {
return d;
}) // scale width of bar occording to data
.attr("height", 19)
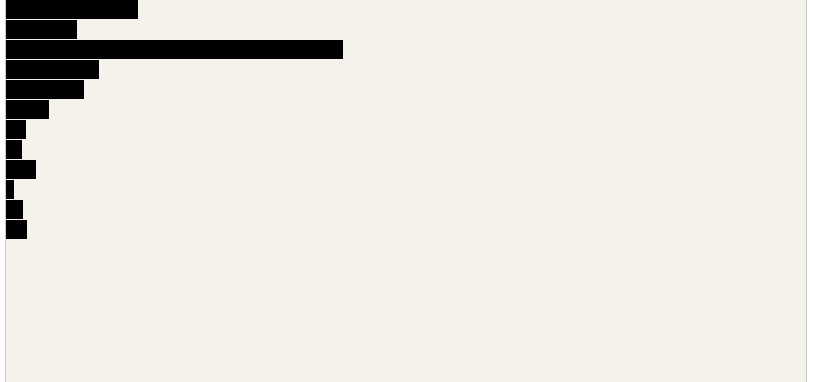
Bar Chart: Scaling
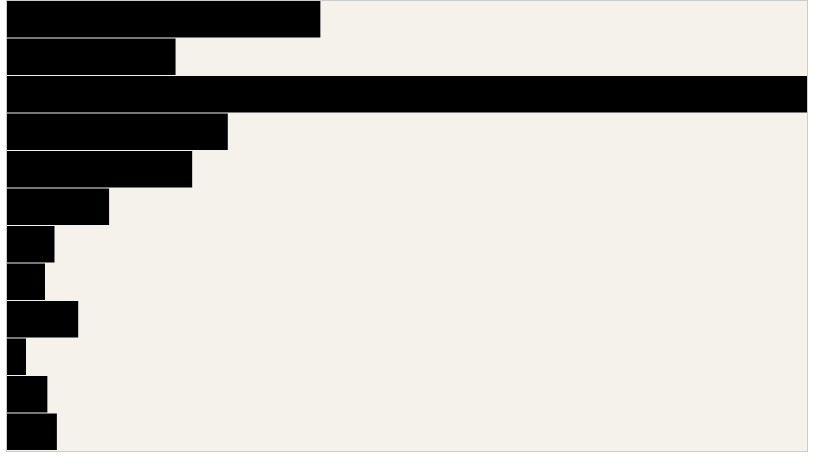
One way to do this mathematically:
var data = [132,71,337,93,78,43,20,16,30,8,17,21];
var width = 800;
var height = 450;
var svg = d3.select("body").append("svg")
.attr("id", "chart")
.attr("width", width)
.attr("height", height)
svg.selectAll(".bar") // attribute class
.data(data) // data source
.enter() // bind data
.append("rect") // append a rectangle for each element in data
.attr("class", "bar") // future attributes
.attr("x", 0) // x position
.attr("y", function(d, i) {
return i * (width / data.length);
}) // y position stacked reletive to i
.attr("width", function(d, i) {
return d;
}) // scale width of bar occording to data
.attr("height", function(d, i) {
return (width / data.length) -1;
}) // scale height reletive to the height available (450)
But d3 make it easy for us!
var data = [132,71,337,93,78,43,20,16,30,8,17,21];
var width = 800;
var height = 450;
// scale everything reletive to the maximum value, as well as the space available to us
var x = d3.scale.linear()
.domain([0, d3.max(data)])
.range([0, width])
// since height is static, we compare to the amount of data, and we scale to the space available
var y = d3.scale.linear()
.domain([0, data.length])
.range([0, height])
var svg = d3.select("body").append("svg")
.attr("id", "chart")
.attr("width", width)
.attr("height", height)
svg.selectAll(".bar") // attribute class
.data(data) // data source
.enter() // bind data
.append("rect") // append a rectangle for each element in data
.attr("class", "bar") // future attributes
.attr("x", 0) // x position
.attr("y", function(d, i) {
return y(i)
}) // y position stacked reletive to i
.attr("width", function(d, i) {
return x(d);
}) // scale width of bar occording to data
.attr("height", function(d, i) {
return y(1) - 1;
}) // scale height reletive to the height available (450)
Bar Chart: CSS Styling
.bar {
fill: lightgreen;
shape-rendering: crispEdges; /* remove aliasing */
}
Adding additional classes
// replace with
.classed("bar", true)
.classed("foo", true)
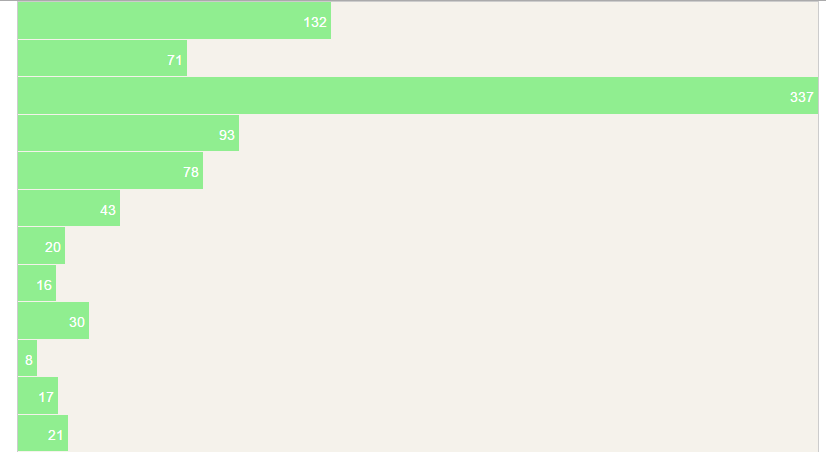
Bar Chart: Adding Text
svg.selectAll("bar-label") // new class creattion
.data(data)
.enter()
.append("text") // text element to class
.classed("bar-label", true)
.attr("x", function(d, i) {
return x(d);
})// scale to end of bars
.attr("y", function(d, i) {
return y(i);
}) // y position of text should scale just like the bars
.attr("dy", function(d, i){
return y(1) / 1.5;
}) // elegent way of adding some padding to the y position 1.5 is a smart number that insures it centers within the bar
.attr("dx", -4) // nudge text width to bar 4 pixels
.text(function(d, i) {
return d;
});
.bar-label {
fill: white;
font: 18px;
text-anchor: end; /* sets text to left end of bar */
}
Bar Chart: Adding Flexibility with Chart Function
The goal of this next section is to try and make a convenient way to plot our data, and make our code a little bit more reusable.
To do so, we encapsulate it within a function that accept an object containing a data key value pair.
function barPlot(params){
this.selectAll(".bar") // attribute class
.data(params.data) // data source
.enter() // bind data
.append("rect") // append a rectangle for each element in data
.classed("bar", true)
.classed("foo", true)
.attr("x", 0) // x position
.attr("y", function(d, i) {
return y(i)
}) // y position stacked reletive to i
.attr("width", function(d, i) {
return x(d);
}) // scale width of bar occording to data
.attr("height", function(d, i) {
return y(1) - 1;
}) // scale height reletive to the height available (450)
this.selectAll("bar-label") // new class creattion
.data(params.data)
.enter()
.append("text") // text element to class
.classed("bar-label", true)
.attr("x", function(d, i) {
return x(d);
})// scale to end of bars
.attr("y", function(d, i) {
return y(i);
}) // y position of text should scale just like the bars
.attr("dy", function(d, i){
return y(1) / 1.5;
}) // elegent way of adding some padding to the y position 1.5 is a smart number that insures it centers within the bar
.attr("dx", -4) // nudge text width to bar 4 pixels
.text(function(d, i) {
return d;
});
}
// .call passes the this keyword to documents DOM svg, as opposed to the global window.
barPlot.call(svg, {
data: data
});
Bar Chart: Grouping Elements
To organize things a bit more, we can group all of our elements together
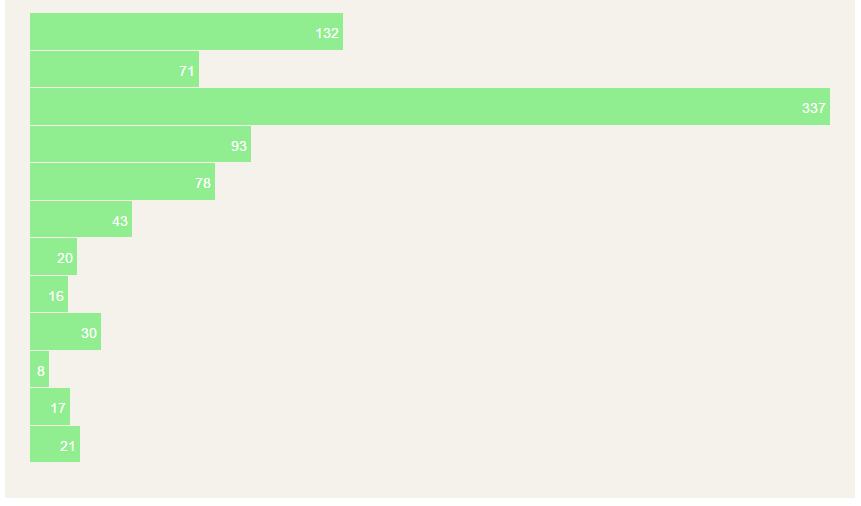
Here is our final product
I've also cleaned up somethings
<!DOCTYPE html>
<html lang="en">
<head>
<meta charset="UTF-8">
<title>Learning D3</title>
<link rel="stylesheet" href="main.css">
<script type="text/javascript" src="d3.min.js"></script>
</head>
<body>
<!--Place all DOM elements here -->
<div id="svgWrap">
</div>
<script>
//Write your code here
var data = [132,71,337,93,78,43,20,16,30,8,17,21];
var width = 800;
var height = 450;
// scale everything reletive to the maximum value, as well as the space available to us
var x = d3.scale.linear()
.domain([0, d3.max(data)])
.range([0, width])
// since height is static, we compare to the amount of data, and we scale to the space available
var y = d3.scale.linear()
.domain([0, data.length])
.range([0, height])
var svg = d3.select("#svgWrap").append("svg")
.attr("id", "chart")
.attr("width", width)
.attr("height", height)
// grouping svg elements
var char = svg.append("g")
.classed("display", true)
function barPlot(params){
this.selectAll(".bar") // attribute class
.data(params.data) // data source
.enter() // bind data
.append("rect") // append a rectangle for each element in data
.classed("bar", true)
.classed("foo", true)
.attr("x", 0) // x position
.attr("y", function(d, i) {
return y(i)
}) // y position stacked reletive to i
.attr("width", function(d, i) {
return x(d);
}) // scale width of bar occording to data
.attr("height", function(d, i) {
return y(1) - 1;
}) // scale height reletive to the height available (450)
this.selectAll("bar-label") // new class creattion
.data(params.data)
.enter()
.append("text") // text element to class
.classed("bar-label", true)
.attr("x", function(d, i) {
return x(d);
})// scale to end of bars
.attr("y", function(d, i) {
return y(i);
}) // y position of text should scale just like the bars
.attr("dy", function(d, i){
return y(1) / 1.5;
}) // elegent way of adding some padding to the y position 1.5 is a smart number that insures it centers within the bar
.attr("dx", -4) // nudge text width to bar 4 pixels
.text(function(d, i) {
return d;
});
}
barPlot.call(svg, {
data: data
});
</script>
</body>
</html>
body,html{
margin: 0;
padding: 0;
font-family: "Arial", sans-serif;
font-size: 0.95em;
text-align: center;
}
#svgWrap{
background-color: #F5F2EB;
width: 850px;
height: 500px;
margin: auto;
}
.bar {
fill: lightgreen;
shape-rendering: crispEdges; /* remove aliasing */
}
.bar-label {
fill: white;
font: 18px;
text-anchor: end; /* sets text to left end of bar */
}
#chart {
margin: 15px;
}
Last updated
Was this helpful?